Comparison and Check Stars
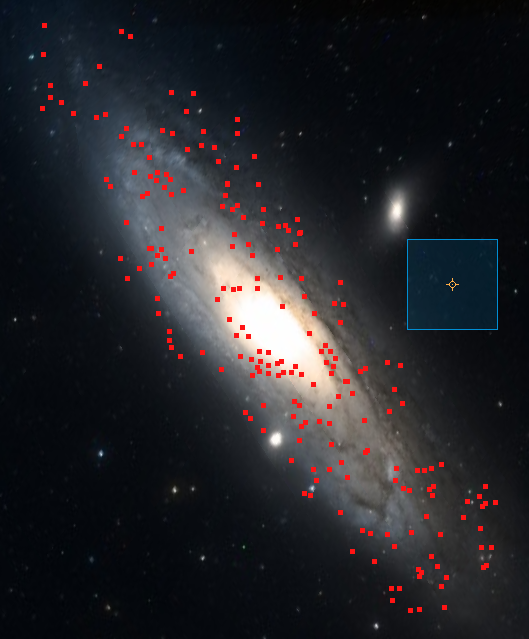
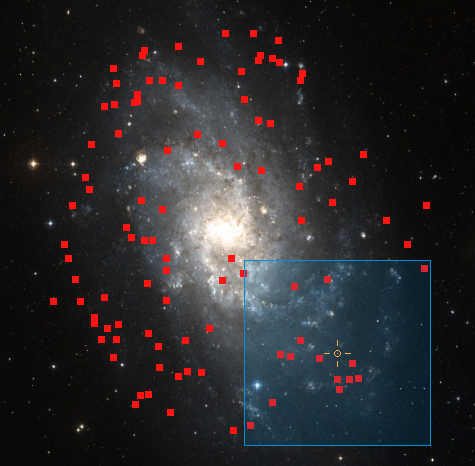
The photometric solutions to the images in the Survey are computed using a list of comparison stars derived from the AAVSO Photometric All Sky Catalog (APASS). The list and how it is derived is described in a presentation to the 2020 Symposium on Telescope Science (see the publication page for the Survey. A list of stars used to check the photometry is presented in the same publication.
The IDs for the stars are automatically generated from the right ascension (RA) and V magnitude (V) of the star using the formula:
ID = INT((V-10)*10+0.5)+INT((RA-10)x100+0.5)/1000
These follow links are electronic copies of the lists provided in different formats.
The Lists
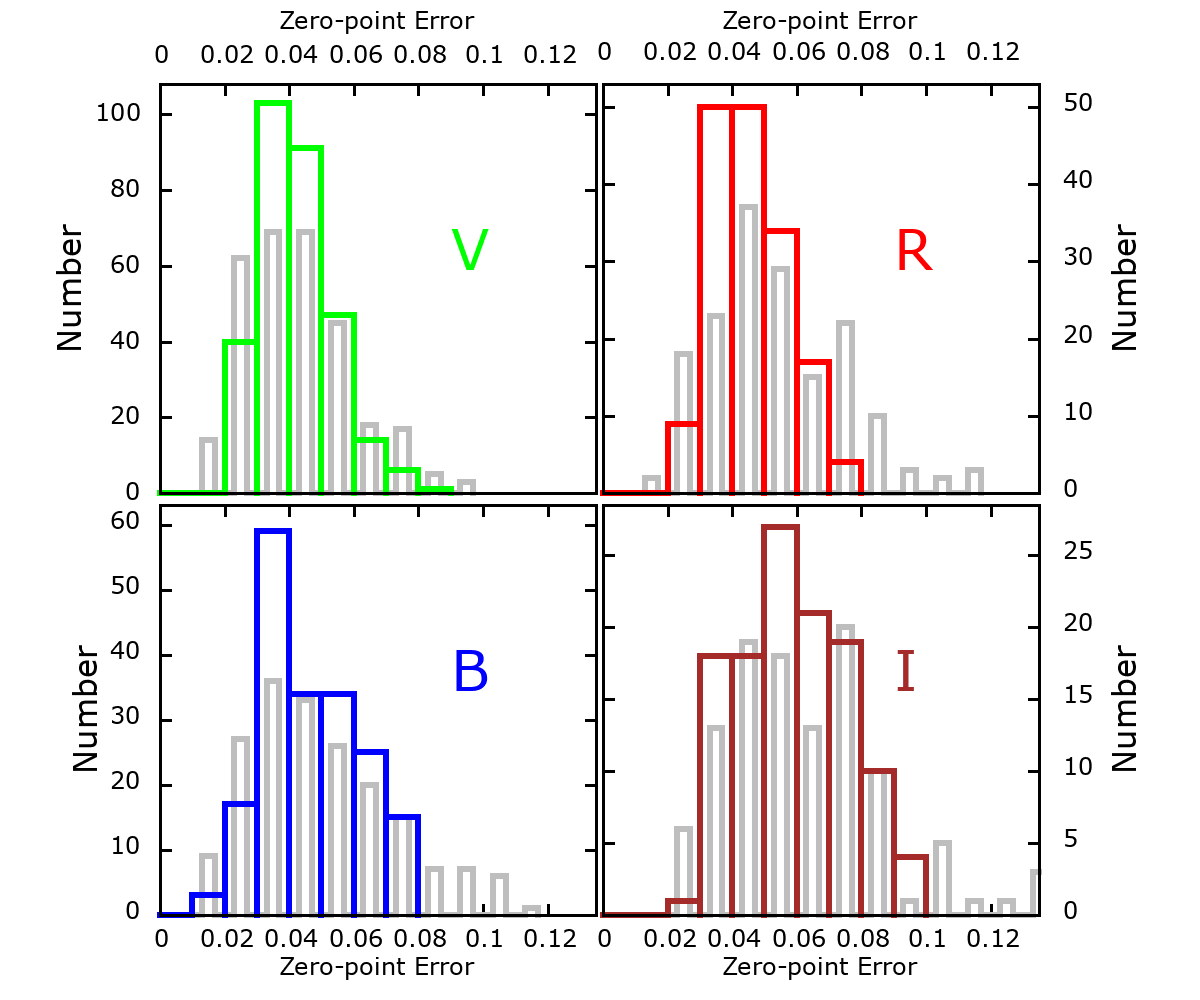
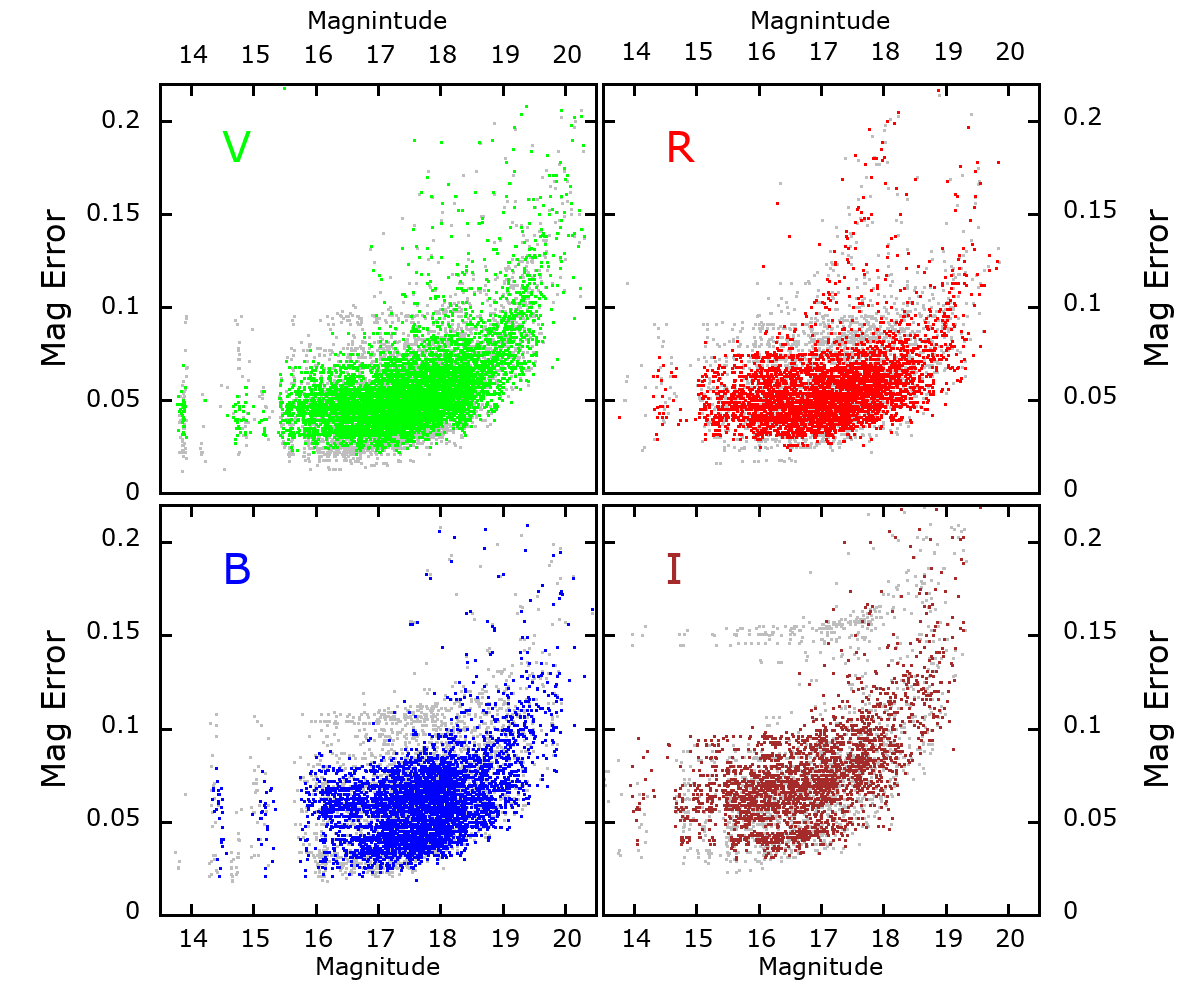
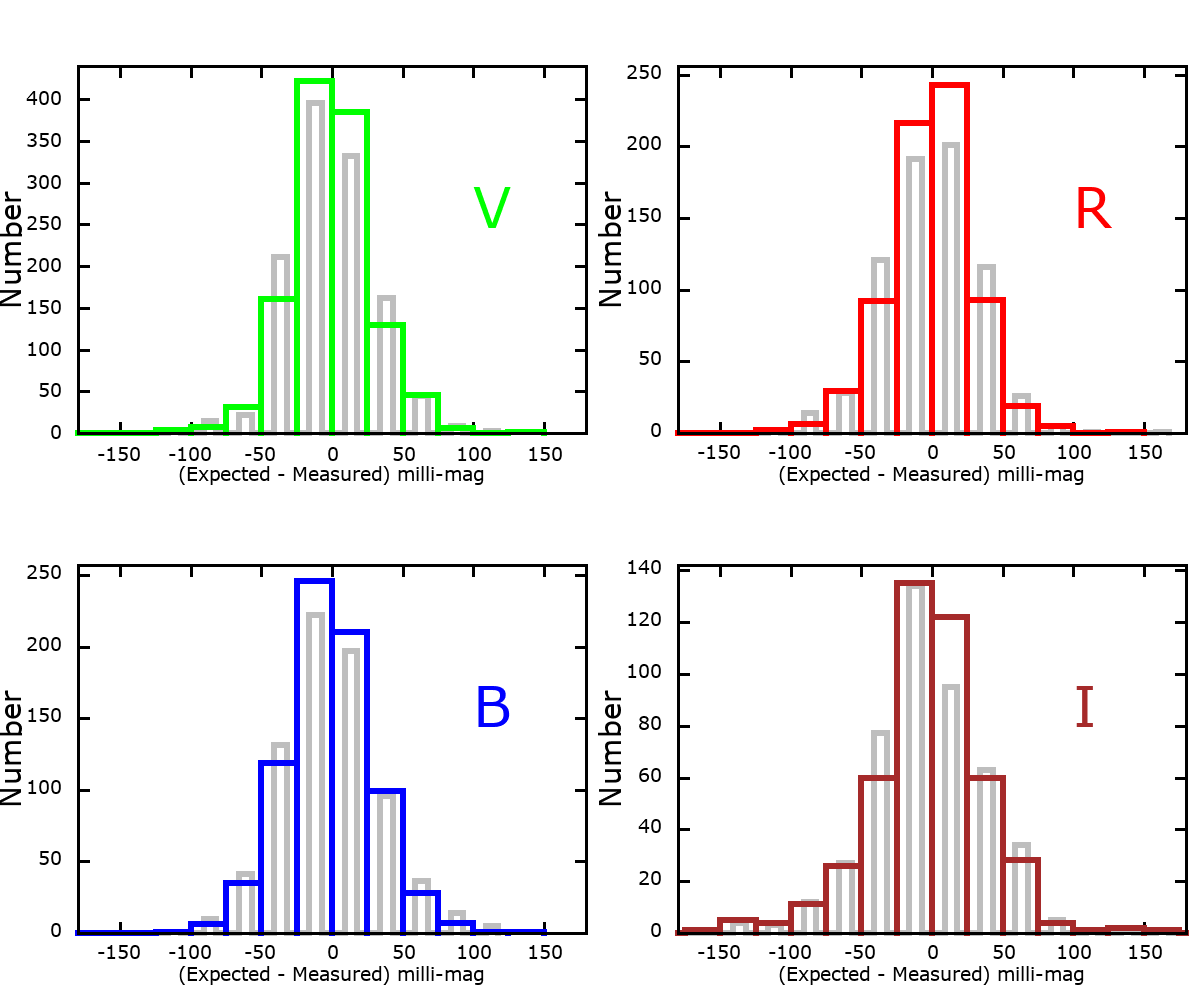
Plots
See the publication in the proceedings of the 2020 Society for Astronomical Sciences Symposium for details. These are color versions of the plots in the proceedings and the presentation.
By John C. Martin, University of Illinois Springfield Henry R. Barber Research Observatory
Updated on 2020-05-21 UT-5