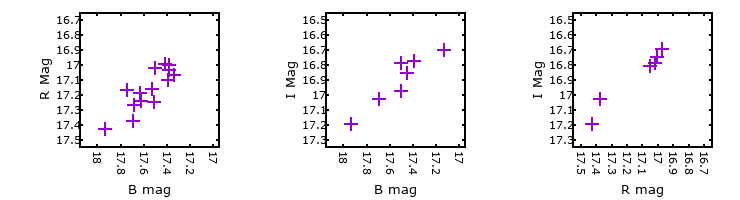
Photometry Table
| MJD | V | * | Image | B | * | Image | R | * | Images | I | * | Images |
|---|---|---|---|---|---|---|---|---|---|---|---|---|
| 56142.31 | 16.95± 0.05 | TA | 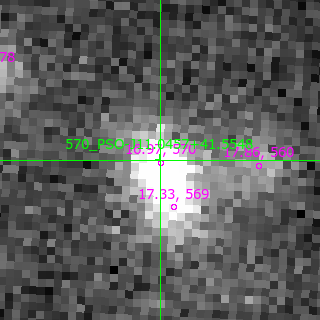  | -- | - | - | -- | - | - | -- | - | - |
| 56267.15 | -- | - | - | -- | - | - | 16.81± 0.04 | T |   | -- | - | - |
| 56490.36 | 17.20± 0.04 | A |   | 17.48± 0.05 | A |   | -- | - | - | -- | - | - |
| 56536.23 | 17.20± 0.07 | A |   | -- | - | - | 17.05± 0.04 | A |   | -- | - | - |
| 56915.13 | 17.33± 0.04 | - |  | 17.51± 0.05 | - |  | 17.25± 0.04 | - |  | -- | - | - |
| 57227.31 | 17.53± 0.04 | - |  | 17.74± 0.04 | - |  | 17.17± 0.04 | - |  | -- | - | - |
| 57310.08 | 17.64± 0.11 | - |  | -- | - | - | -- | - | - | 16.66± 0.07 | X |  |
| 57633.28 | 17.46± 0.04 | - |  | 17.62± 0.05 | - |  | 17.24± 0.05 | - |  | -- | - | - |
| 57638.27 | 17.54± 0.05 | - |  | -- | - | - | -- | - | - | 17.07± 0.05 | - |  |
| 57928.37 | 16.84± 0.04 | X |  | 18.10± 0.06 | X |  | 17.05± 0.04 | X |  | 16.31± 0.06 | X | 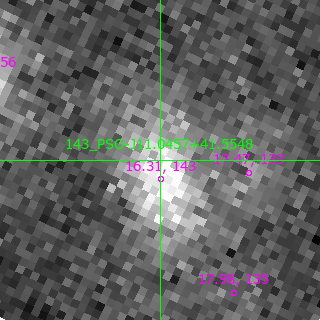 |
| 57958.29 | 17.36± 0.05 | - |  | 17.45± 0.05 | - |  | -- | - | - | 16.85± 0.05 | - | 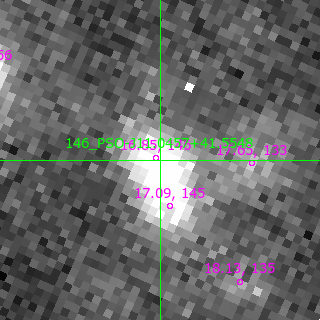 |
| 57988.34 | 17.55± 0.05 | - |  | 17.70± 0.04 | - |  | 17.38± 0.06 | - |  | 17.03± 0.04 | - |  |
| 58043.06 | 17.60± 0.06 | - |  | 17.50± 0.05 | - |  | -- | - | - | 16.97± 0.06 | - |  |
| 58077.11 | 17.60± 0.06 | - |  | 17.94± 0.07 | - |  | 17.43± 0.06 | - |  | 17.19± 0.08 | - |  |
| 58098.09 | 17.66± 0.07 | - |  | 17.53± 0.04 | - |  | 17.16± 0.04 | A |   | -- | - | - |
| 58312.29 | 17.39± 0.04 | - |  | 17.63± 0.05 | - |  | 17.19± 0.04 | - |  | -- | - | - |
| 58316.26 | 17.63± 0.06 | - |  | -- | - | - | -- | - | - | 17.00± 0.05 | - |  |
| 58339.35 | 17.41± 0.04 | - |  | 17.68± 0.04 | - |  | 17.27± 0.06 | - |  | -- | - | - |
| 58341.23 | 17.26± 0.06 | - |  | 17.50± 0.05 | - |  | -- | - | - | -- | - | - |
| 58342.31 | 17.38± 0.04 | - |  | -- | - | - | -- | - | - | 17.03± 0.05 | - |  |
| 58366.12 | 17.26± 0.04 | - |  | 17.67± 0.06 | - |  | -- | - | - | -- | - | - |
| 58375.12 | 17.34± 0.04 | - |  | -- | - | - | 17.30± 0.08 | - |  | -- | - | - |
| 58403.08 | 17.23± 0.04 | - |  | -- | - | - | -- | - | - | 16.95± 0.07 | - |  |
| 58433.09 | 17.22± 0.06 | - |  | 17.41± 0.06 | - |  | 16.99± 0.06 | - |  | -- | - | - |
| 58671.33 | 17.19± 0.06 | A |   | 17.32± 0.05 | A |   | -- | - | - | -- | - | - |
| 58673.29 | 17.25± 0.08 | - |  | -- | - | - | 16.97± 0.07 | - |  | 16.69± 0.08 | - |  |
| 58695.34 | 17.16± 0.05 | - |  | -- | - | - | 17.01± 0.04 | - |  | 16.75± 0.04 | - |  |
| 58696.30 | 17.19± 0.07 | - |  | 17.39± 0.07 | - |  | 17.00± 0.08 | - |  | -- | - | - |
| 58750.10 | 17.14± 0.06 | A |   | 17.32± 0.06 | A |   | -- | - | - | -- | - | - |
| 58779.07 | 17.29± 0.07 | A |   | -- | - | - | 17.04± 0.05 | A |   | -- | - | - |
| 58812.08 | 17.27± 0.06 | A |   | -- | - | - | 17.05± 0.08 | - |  | 16.81± 0.05 | - |  |
| 59000.39 | 17.05± 0.07 | - |  | -- | - | - | 16.63± 0.11 | X |  | -- | - | - |
| 59055.31 | 17.25± 0.07 | - |  | -- | - | - | 17.01± 0.09 | - |  | -- | - | - |
| 59077.20 | 17.20± 0.08 | - |  | 17.51± 0.09 | - |  | 17.02± 0.08 | - |  | 16.79± 0.10 | - |  |
| 59131.09 | 17.17± 0.07 | - |  | -- | - | - | 16.95± 0.07 | - |  | -- | - | - |
| 59166.12 | 17.25± 0.08 | - |  | -- | - | - | -- | - | - | 16.79± 0.10 | - | 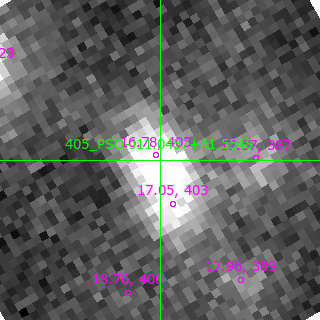 |
| 59194.11 | 17.22± 0.07 | - | 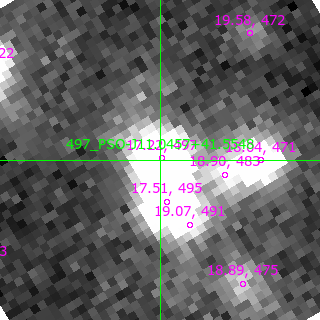 | 17.38± 0.07 | - | 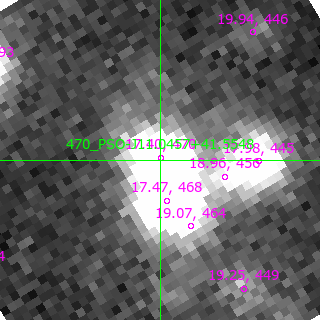 | -- | - | - | -- | - | - |
| 59376.35 | 17.12± 0.07 | - | 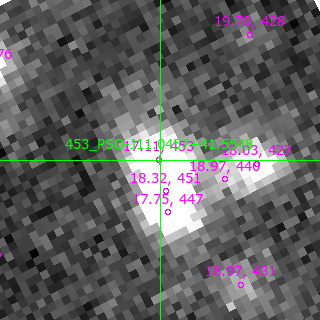 | 17.25± 0.07 | - |  | -- | - | - | -- | - | - |
| 59409.37 | 17.16± 0.08 | - |  | -- | - | - | 16.98± 0.08 | - |  | -- | - | - |
| 59441.26 | 17.34± 0.08 | - |  | 17.39± 0.08 | - | 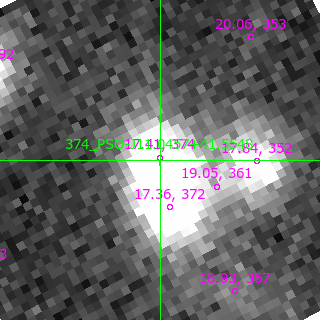 | -- | - | - | 16.77± 0.09 | - | 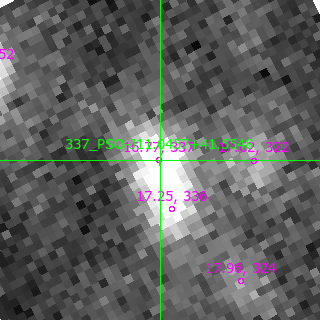 |
| 59467.11 | 17.17± 0.11 | - |  | -- | - | - | 17.13± 0.08 | - |  | -- | - | - |
| 59522.04 | 17.02± 0.07 | - | 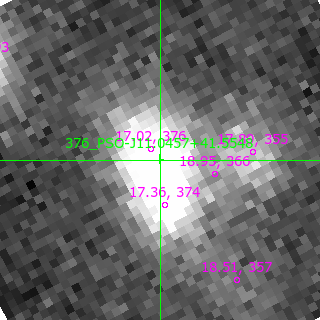 | 17.13± 0.07 | - |  | -- | - | - | 16.70± 0.12 | - |  |
| 59546.05 | 17.20± 0.07 | - |  | -- | - | - | 16.96± 0.07 | T |  | -- | - | - |
| 59583.10 | 17.12± 0.07 | - |  | 17.32± 0.07 | T |  | -- | - | - | -- | - | - |
| 59739.36 | 17.16± 0.07 | - |  | 17.34± 0.08 | - |  | 17.06± 0.08 | - |  | -- | - | - |
| 59816.14 | 17.32± 0.08 | - |  | -- | - | - | -- | - | - | 16.79± 0.07 | - |  |
| 59851.09 | 17.55± 0.14 | - |  | 17.39± 0.08 | - |  | 17.10± 0.09 | - |  | -- | - | - |
| 59879.03 | 17.08± 0.07 | - |  | -- | - | - | -- | - | - | 16.68± 0.07 | - | 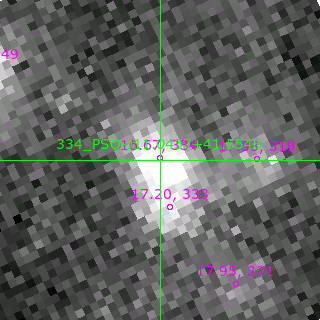 |
| 59905.07 | 17.32± 0.07 | - |  | 17.38± 0.07 | - |  | 17.03± 0.07 | - | 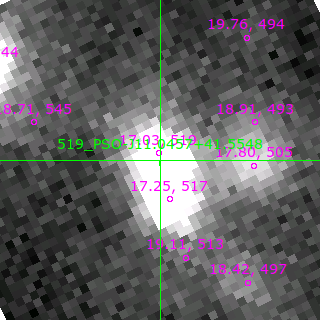 | -- | - | - |
| 60147.26 | 17.19± 0.07 | - |  | 17.34± 0.07 | - |  | -- | - | - | -- | - | - |
| 60172.17 | 17.23± 0.07 | - |  | 17.26± 0.07 | - |  | 16.99± 0.06 | - |  | 16.88± 0.08 | - |  |
| 60202.10 | 17.09± 0.08 | - |  | 17.13± 0.08 | - |  | -- | - | - | -- | - | - |
| 60251.01 | 17.13± 0.08 | - |  | -- | - | - | -- | - | - | 16.54± 0.07 | - |  |
| 60290.10 | 17.36± 0.14 | - |  | -- | - | - | 16.88± 0.08 | - |  | -- | - | - |
| 60469.35 | 17.17± 0.07 | - |  | 17.42± 0.08 | - |  | -- | - | - | -- | - | - |
| 60504.31 | 17.16± 0.07 | - |  | -- | - | - | 16.93± 0.06 | - |  | -- | - | - |
| 60529.23 | 17.30± 0.09 | - |  | -- | - | - | -- | - | - | 16.67± 0.07 | - |  |
| 60555.13 | 17.30± 0.07 | - |  | 17.48± 0.07 | - |  | 16.97± 0.06 | - |  | -- | - | - |
| 60587.10 | 17.22± 0.07 | - |  | -- | - | - | -- | - | - | 16.74± 0.07 | - |  |
| 60649.08 | 17.25± 0.07 | - |  | 17.34± 0.07 | - |  | 16.90± 0.07 | - |  | -- | - | - |
| 60880.23 | 17.19± 0.09 | - |  | 17.42± 0.09 | - |  | -- | - | - | -- | - | - |
| 61055.15 | 17.42± 0.07 | - |  | -- | - | - | -- | - | - | 16.89± 0.09 | - |  |