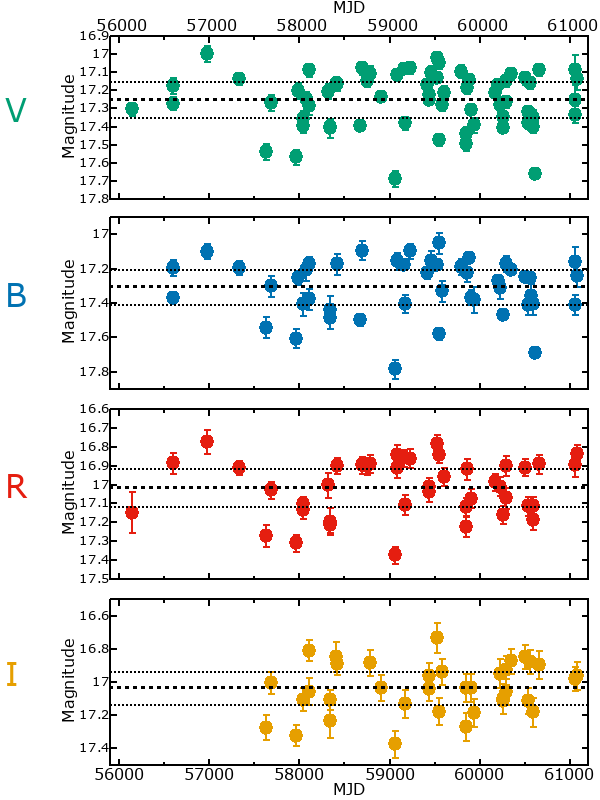
Photometry Table
| MJD | V | * | Image | B | * | Image | R | * | Images | I | * | Images |
|---|---|---|---|---|---|---|---|---|---|---|---|---|
| 56140.39 | 17.30± 0.04 | - |  | -- | - | - | 17.15± 0.11 | - |  | -- | - | - |
| 56593.16 | 17.27± 0.03 | - |  | 17.37± 0.03 | - |  | -- | - | - | -- | - | - |
| 56599.18 | 17.18± 0.04 | A |   | 17.20± 0.05 | A |   | 16.89± 0.06 | A |   | -- | - | - |
| 56976.19 | 17.00± 0.04 | - |  | 17.10± 0.04 | - |  | 16.77± 0.07 | - |  | -- | - | - |
| 57328.16 | 17.14± 0.03 | - |  | 17.20± 0.04 | - |  | 16.91± 0.04 | - |  | -- | - | - |
| 57634.36 | 17.54± 0.04 | A |   | 17.55± 0.06 | A |   | 17.27± 0.06 | A |   | 17.28± 0.07 | A |   |
| 57687.13 | 17.27± 0.04 | - |  | 17.30± 0.06 | - |  | 17.03± 0.04 | - |  | 17.01± 0.07 | - |  |
| 57964.37 | 17.57± 0.04 | - |  | 17.61± 0.06 | - |  | 17.31± 0.04 | - |  | 17.32± 0.06 | - |  |
| 57988.41 | 17.20± 0.04 | - |  | 17.25± 0.04 | - |  | -- | - | - | -- | - | - |
| 58043.10 | 17.36± 0.04 | - |  | -- | - | - | 17.11± 0.04 | - |  | 17.11± 0.07 | - |  |
| 58045.15 | 17.39± 0.04 | - |  | 17.41± 0.07 | - |  | 17.14± 0.04 | - |  | -- | - | - |
| 58073.18 | 17.25± 0.04 | - |  | 17.21± 0.06 | - |  | -- | - | - | -- | - | - |
| 58103.16 | 17.09± 0.04 | A |   | 17.17± 0.04 | - |  | -- | - | - | 16.81± 0.06 | - |  |
| 58108.14 | 17.29± 0.05 | - |  | 17.38± 0.06 | - |  | -- | - | - | 17.06± 0.08 | - |  |
| 58317.39 | 17.21± 0.04 | - |  | -- | - | - | 17.00± 0.07 | - |  | -- | - | - |
| 58341.40 | 17.41± 0.05 | - |  | 17.44± 0.08 | - |  | 17.20± 0.07 | - |  | 17.24± 0.10 | - |  |
| 58342.36 | 17.40± 0.04 | - |  | 17.49± 0.06 | - |  | 17.21± 0.04 | - |  | 17.11± 0.06 | - |  |
| 58403.15 | 17.17± 0.04 | - |  | -- | - | - | -- | - | - | 16.85± 0.09 | - |  |
| 58420.06 | 17.17± 0.04 | - |  | 17.17± 0.06 | - |  | 16.90± 0.04 | - |  | 16.89± 0.07 | - |  |
| 58673.38 | 17.40± 0.03 | - |  | 17.50± 0.04 | - |  | -- | - | - | -- | - | - |
| 58696.39 | 17.08± 0.04 | - |  | 17.09± 0.06 | - |  | 16.90± 0.04 | - |  | -- | - | - |
| 58750.19 | 17.15± 0.03 | - |  | -- | - | - | 16.90± 0.05 | - |  | -- | - | - |
| 58779.15 | 17.11± 0.04 | - |  | -- | - | - | 16.89± 0.05 | - |  | 16.88± 0.08 | - |  |
| 58902.05 | 17.23± 0.03 | - |  | -- | - | - | -- | - | - | 17.04± 0.08 | - |  |
| 59056.38 | 17.69± 0.05 | - |  | 17.79± 0.06 | - |  | 17.38± 0.05 | - |  | 17.38± 0.08 | - |  |
| 59082.34 | 17.11± 0.03 | A |   | 17.16± 0.05 | A |   | 16.91± 0.05 | A |   | -- | - | - |
| 59084.29 | -- | - | - | -- | - | - | 16.85± 0.05 | T |  | -- | - | - |
| 59161.11 | 17.08± 0.03 | - |  | 17.18± 0.03 | - |  | 16.86± 0.04 | - |  | -- | - | - |
| 59171.09 | 17.38± 0.04 | A |   | 17.41± 0.05 | A |   | 17.11± 0.05 | - |  | 17.13± 0.08 | A |   |
| 59227.08 | 17.08± 0.03 | A |   | 17.10± 0.04 | A |   | 16.86± 0.05 | - |  | -- | - | - |
| 59415.38 | 17.17± 0.03 | - |  | 17.23± 0.03 | - |  | -- | - | - | -- | - | - |
| 59441.41 | 17.23± 0.04 | - |  | -- | - | - | 17.04± 0.05 | - |  | 16.96± 0.07 | - |  |
| 59442.39 | 17.25± 0.02 | - |  | -- | - | - | 17.01± 0.05 | - |  | 17.04± 0.08 | - |  |
| 59463.27 | 17.10± 0.04 | - |  | 17.15± 0.06 | - |  | -- | - | - | -- | - | - |
| 59523.17 | 17.13± 0.02 | - |  | 17.18± 0.02 | - |  | -- | - | - | -- | - | - |
| 59525.15 | 17.02± 0.03 | A |   | -- | - | - | 16.79± 0.05 | - |  | 16.73± 0.09 | - |  |
| 59546.19 | 17.05± 0.03 | A |   | 17.05± 0.06 | - |  | 16.84± 0.04 | - |  | -- | - | - |
| 59551.12 | 17.48± 0.03 | A |   | 17.58± 0.03 | - |  | -- | - | - | 17.18± 0.08 | - |  |
| 59583.17 | 17.28± 0.03 | A |   | 17.33± 0.06 | - |  | -- | - | - | 16.94± 0.08 | - |  |
| 59608.11 | 17.21± 0.04 | A |   | -- | - | - | 16.96± 0.05 | A |   | -- | - | - |
| 59794.37 | 17.10± 0.04 | A |   | 17.19± 0.05 | A |   | -- | - | - | -- | - | - |
| 59849.18 | 17.44± 0.04 | A |   | -- | - | - | 17.12± 0.05 | - |  | 17.04± 0.08 | - |  |
| 59851.16 | 17.50± 0.04 | A |   | -- | - | - | 17.22± 0.06 | - |  | 17.27± 0.08 | - |  |
| 59854.19 | 17.18± 0.04 | A |   | 17.23± 0.05 | A |   | 16.92± 0.05 | - |  | -- | - | - |
| 59879.15 | 17.14± 0.04 | - |  | 17.14± 0.03 | - |  | -- | - | - | -- | - | - |
| 59903.20 | 17.31± 0.03 | A |   | 17.37± 0.04 | A |   | 17.07± 0.05 | A |   | 17.04± 0.08 | A |   |
| 59932.16 | 17.39± 0.04 | A |   | 17.38± 0.08 | - |  | -- | - | - | 17.19± 0.09 | - |  |
| 60172.39 | 17.21± 0.02 | - |  | -- | - | - | 16.99± 0.04 | - |  | -- | - | - |
| 60205.17 | 17.17± 0.03 | - |  | 17.27± 0.03 | - |  | -- | - | - | -- | - | - |
| 60227.11 | 17.28± 0.04 | A |   | 17.31± 0.07 | - |  | 17.01± 0.05 | - |  | 16.95± 0.09 | - |  |
| 60261.11 | 17.34± 0.03 | A |   | -- | - | - | 17.16± 0.05 | - |  | 17.11± 0.08 | - |  |
| 60262.16 | 17.41± 0.03 | - |  | 17.47± 0.03 | - |  | -- | - | - | 17.11± 0.09 | - |  |
| 60290.15 | 17.15± 0.03 | A |   | 17.18± 0.05 | A |   | 16.90± 0.05 | - |  | 16.93± 0.09 | - |  |
| 60292.18 | 17.27± 0.03 | A |   | -- | - | - | 17.07± 0.06 | - |  | 17.06± 0.08 | - |  |
| 60342.10 | 17.11± 0.03 | A |   | 17.21± 0.03 | - |  | -- | - | - | 16.88± 0.07 | - |  |
| 60506.37 | 17.13± 0.04 | A |   | 17.25± 0.03 | - |  | 16.91± 0.04 | - |  | 16.85± 0.07 | - |  |
| 60529.38 | 17.38± 0.04 | - |  | 17.41± 0.06 | - |  | -- | - | - | -- | - | - |
| 60533.38 | 17.32± 0.03 | - |  | -- | - | - | 17.12± 0.05 | - |  | 17.11± 0.08 | - |  |
| 60556.29 | 17.16± 0.03 | A |   | 17.25± 0.02 | - |  | -- | - | - | 16.88± 0.07 | - |  |
| 60564.22 | 17.34± 0.04 | - |  | 17.36± 0.07 | - |  | 17.12± 0.05 | - |  | -- | - | - |
| 60594.12 | 17.40± 0.03 | - | -- | - | - | 17.19± 0.06 | - | 17.18± 0.09 | - | |||
| 60595.13 | 17.35± 0.04 | - |  | 17.40± 0.07 | - |  | 17.11± 0.05 | - |   | -- | - | - |
| 60612.16 | 17.66± 0.03 | - |  | 17.69± 0.02 | - |  | -- | - | - | -- | - | - |
| 60651.17 | 17.09± 0.03 | A |   | -- | - | - | 16.89± 0.05 | - |  | 16.90± 0.09 | - |  |
| 61052.19 | 17.09± 0.08 | - |  | 17.16± 0.09 | - |  | 16.90± 0.06 | - |  | -- | - | - |
| 61053.19 | 17.33± 0.05 | - |  | 17.41± 0.06 | - |  | -- | - | - | -- | - | - |
| 61055.17 | 17.25± 0.08 | - |  | -- | - | - | -- | - | - | 16.98± 0.07 | - |  |
| 61080.09 | 17.14± 0.06 | A |   | 17.24± 0.07 | - |  | 16.84± 0.05 | - |  | 16.96± 0.09 | - |  |