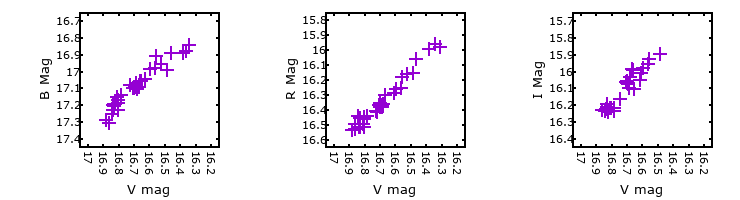
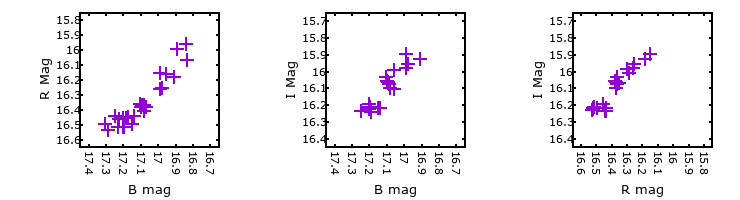
Photometry Table
| MJD | V | * | Image | B | * | Image | R | * | Images | I | * | Images |
|---|---|---|---|---|---|---|---|---|---|---|---|---|
| 56140.38 | 16.32± 0.04 | A |   | -- | - | - | 15.98± 0.07 | A |   | -- | - | - |
| 56593.16 | 16.36± 0.03 | - | 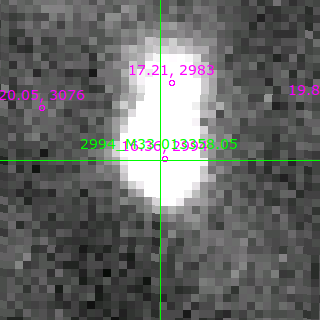 | 16.88± 0.02 | - | 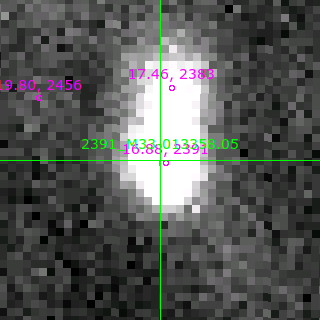 | -- | - | - | -- | - | - |
| 56599.18 | 16.39± 0.04 | A |   | 16.89± 0.05 | A |   | 15.99± 0.05 | A |   | -- | - | - |
| 56976.18 | 16.34± 0.04 | A |   | 16.84± 0.05 | A |   | 15.96± 0.06 | A | 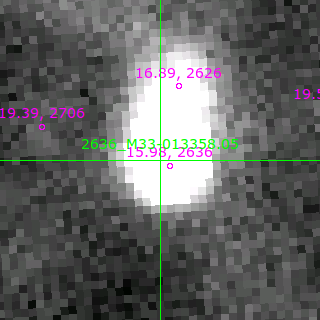  | -- | - | - |
| 57038.13 | 16.53± 0.04 | - |  | 16.96± 0.05 | - |  | 16.16± 0.04 | - |  | -- | - | - |
| 57310.13 | 16.41± 0.05 | X |  | 16.83± 0.07 | - |  | 16.07± 0.05 | - |  | -- | - | - |
| 57335.18 | 16.46± 0.06 | - |  | -- | - | - | 16.06± 0.04 | - |  | -- | - | - |
| 57401.10 | 16.46± 0.04 | - |  | 16.89± 0.05 | - |  | -- | - | - | -- | - | - |
| 57406.10 | 16.49± 0.04 | - |  | 16.99± 0.04 | - |  | 16.15± 0.05 | - |  | 15.89± 0.07 | - |  |
| 57634.34 | 16.55± 0.04 | - |  | 16.91± 0.07 | - |  | 16.18± 0.05 | - |  | 15.93± 0.06 | - |  |
| 57638.35 | 16.71± 0.03 | - |  | 17.10± 0.06 | - |  | 16.37± 0.05 | - |  | 16.06± 0.07 | - |  |
| 57687.13 | 16.56± 0.04 | - |  | 16.98± 0.06 | - |  | 16.25± 0.04 | - |  | 15.96± 0.06 | - |  |
| 57964.37 | 16.60± 0.04 | - |  | 16.99± 0.06 | - |  | 16.26± 0.04 | - |  | 15.98± 0.06 | - |  |
| 57988.41 | 16.63± 0.04 | - |  | 17.04± 0.04 | - |  | -- | - | - | -- | - | - |
| 58043.10 | 16.67± 0.04 | - |  | -- | - | - | 16.30± 0.04 | - |  | 15.98± 0.06 | - |  |
| 58045.15 | 16.68± 0.04 | - |  | 17.07± 0.07 | - |  | 16.38± 0.04 | - |  | -- | - | - |
| 58073.18 | 16.67± 0.03 | - |  | 17.09± 0.06 | - |  | -- | - | - | -- | - | - |
| 58103.16 | 16.66± 0.04 | A |   | 17.06± 0.04 | - |  | -- | - | - | 16.10± 0.06 | - |  |
| 58108.14 | 16.66± 0.05 | - | 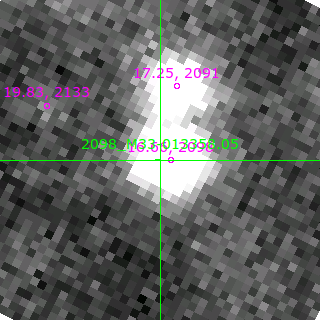 | 17.06± 0.06 | - | 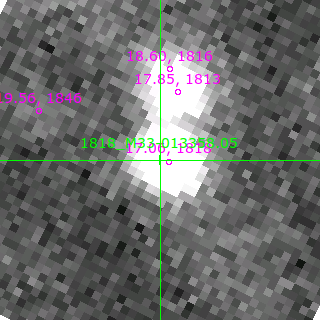 | -- | - | - | 15.99± 0.08 | - | 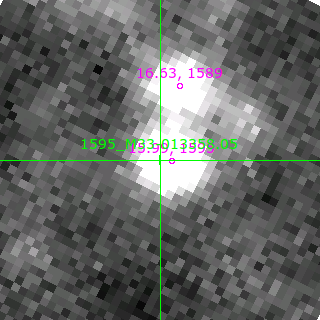 |
| 58316.38 | 16.70± 0.03 | - | 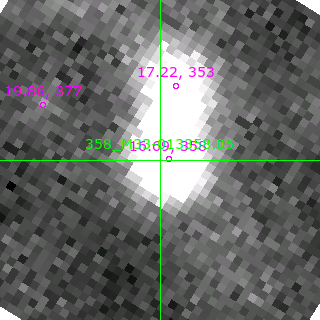 | 17.09± 0.05 | - |  | 16.37± 0.03 | - |  | 16.07± 0.04 | - |  |
| 58317.39 | 16.72± 0.04 | - |  | -- | - | - | 16.41± 0.07 | - |  | -- | - | - |
| 58341.40 | 16.70± 0.05 | - |  | 17.10± 0.08 | - |  | 16.38± 0.07 | - |  | 16.06± 0.10 | - |  |
| 58342.36 | 16.68± 0.03 | - |  | 17.10± 0.06 | - |  | 16.36± 0.03 | - |  | 16.03± 0.06 | - |  |
| 58403.15 | 16.61± 0.04 | - |  | -- | - | - | -- | - | - | 16.05± 0.09 | - |  |
| 58420.06 | 16.69± 0.04 | - |  | 17.08± 0.06 | - |  | 16.37± 0.04 | - |  | 16.10± 0.06 | - |  |
| 58433.00 | 16.70± 0.04 | - |  | -- | - | - | 16.36± 0.05 | - |  | 16.07± 0.06 | - |  |
| 58696.39 | 16.73± 0.04 | - |  | 17.08± 0.06 | - |  | 16.41± 0.04 | - |  | -- | - | - |
| 58779.15 | 16.61± 0.04 | - |  | -- | - | - | 16.29± 0.05 | - |  | 16.01± 0.07 | - |  |
| 58812.22 | 16.74± 0.05 | - |  | -- | - | - | -- | - | - | 16.17± 0.05 | - |  |
| 58902.06 | 16.79± 0.03 | A |   | -- | - | - | 16.44± 0.04 | - |  | 16.23± 0.07 | - |  |
| 59056.38 | 16.83± 0.04 | - |  | 17.20± 0.06 | - |  | 16.45± 0.04 | - |  | 16.20± 0.07 | - |  |
| 59081.33 | 16.80± 0.03 | - |  | 17.17± 0.06 | - |  | 16.45± 0.03 | - |  | -- | - | - |
| 59082.34 | 16.81± 0.03 | A |   | 17.19± 0.05 | A |   | 16.46± 0.05 | A |   | -- | - | - |
| 59084.29 | -- | - | - | -- | - | - | 16.42± 0.05 | T |  | -- | - | - |
| 59161.09 | 16.88± 0.04 | A |   | 17.29± 0.05 | A |   | 16.53± 0.04 | A |   | -- | - | - |
| 59171.09 | 16.84± 0.04 | A |    | 17.25± 0.05 | A |   | 16.44± 0.05 | - |  | 16.24± 0.07 | A |    |
| 59227.08 | 16.84± 0.03 | A |    | 17.23± 0.04 | A |    | 16.52± 0.05 | A |   | -- | - | - |
| 59415.37 | 16.86± 0.04 | A |   | 17.31± 0.03 | - |  | 16.49± 0.04 | - |  | -- | - | - |
| 59441.40 | 16.84± 0.05 | A |   | 17.20± 0.06 | - |  | 16.52± 0.05 | - |  | 16.23± 0.07 | - |  |
| 59442.39 | 16.86± 0.02 | - |  | -- | - | - | 16.53± 0.05 | - |  | 16.23± 0.07 | - |  |
| 59463.28 | 16.82± 0.04 | A |    | 17.19± 0.06 | - |  | -- | - | - | 16.24± 0.05 | - |  |
| 59523.16 | 16.80± 0.03 | A |   | 17.23± 0.03 | - |  | 16.46± 0.04 | - |  | -- | - | - |
| 59525.15 | 16.78± 0.03 | A |    | 17.14± 0.04 | - |  | 16.44± 0.05 | - |  | 16.21± 0.09 | - |  |
| 59546.18 | 16.81± 0.03 | A |   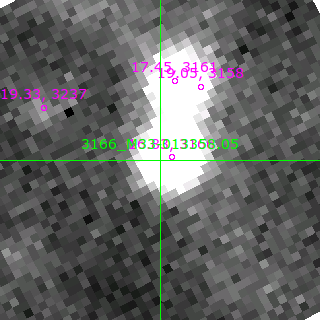 | 17.15± 0.06 | - | 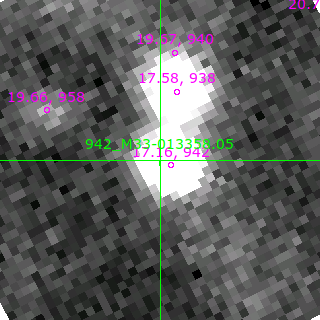 | 16.50± 0.04 | - | 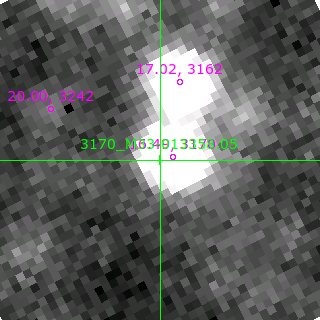 | 16.22± 0.05 | - | 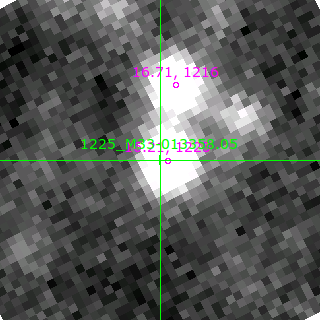 |
| 59551.12 | 16.83± 0.04 | A |    | 17.20± 0.04 | A |   | -- | - | - | 16.21± 0.08 | - |  |
| 59583.16 | 16.83± 0.03 | A |    | 17.20± 0.06 | - |  | 16.51± 0.04 | - |  | 16.21± 0.08 | - |  |
| 59608.09 | 16.80± 0.04 | A |    | -- | - | - | 16.52± 0.05 | A |   | 16.22± 0.05 | - |  |
| 59794.36 | 16.84± 0.04 | A |    | 17.21± 0.05 | A |   | -- | - | - | -- | - | - |
| 59823.24 | 16.85± 0.04 | - |  | 17.23± 0.04 | - |  | -- | - | - | -- | - | - |
| 59849.18 | 16.82± 0.04 | A |   | -- | - | - | 16.48± 0.05 | - |  | 16.21± 0.08 | - |  |
| 59851.15 | 16.84± 0.04 | A |    | -- | - | - | 16.48± 0.05 | A |   | 16.30± 0.08 | - |  |
| 59854.20 | 16.85± 0.04 | A |    | 17.22± 0.05 | A |    | 16.50± 0.05 | - |  | -- | - | - |
| 59879.13 | 16.93± 0.05 | A |   | 17.27± 0.03 | - |  | -- | - | - | 16.26± 0.06 | A |   |
| 59903.20 | 16.87± 0.03 | A |   | 17.26± 0.04 | A |   | 16.54± 0.05 | A |   | 16.22± 0.08 | A |   |
| 59904.12 | 16.88± 0.04 | - |  | 17.25± 0.05 | - |  | 16.55± 0.04 | - |  | 16.30± 0.06 | - |  |
| 59932.15 | 16.86± 0.04 | A |    | 17.17± 0.08 | - |  | 16.54± 0.05 | - |  | 16.24± 0.09 | - |  |
| 60172.38 | 16.95± 0.03 | A |   | 17.30± 0.04 | - |  | 16.57± 0.04 | - |  | -- | - | - |
| 60205.16 | 16.91± 0.04 | A |   | 17.33± 0.03 | - |  | 16.55± 0.05 | - | 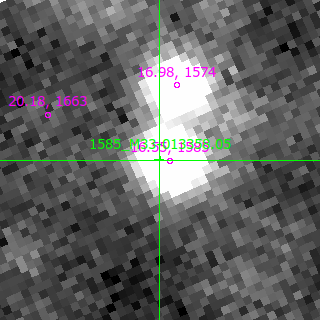 | -- | - | - |
| 60227.11 | 16.88± 0.04 | A | 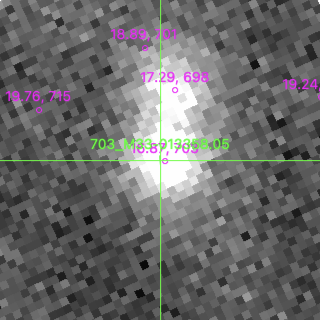   | 17.24± 0.07 | - | 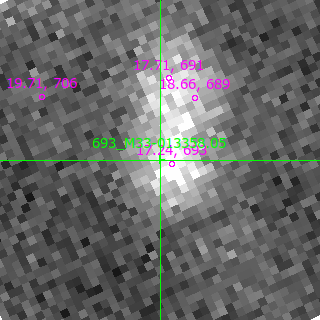 | 16.55± 0.05 | - | 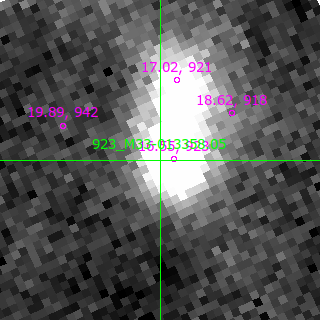 | 16.25± 0.07 | A |  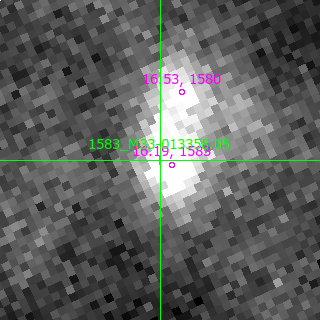 |
| 60261.11 | 16.91± 0.03 | A | 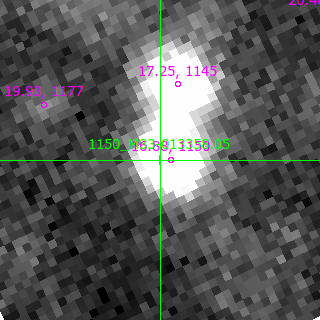  | -- | - | - | 16.54± 0.05 | - |  | 16.28± 0.07 | - |  |
| 60262.14 | 16.91± 0.03 | A |   | 17.30± 0.05 | A |   | 16.57± 0.04 | - |  | 16.23± 0.09 | - |  |
| 60290.15 | 16.91± 0.04 | A |    | 17.26± 0.05 | A |    | 16.60± 0.05 | - |  | 16.30± 0.08 | A |   |
| 60292.18 | 16.91± 0.03 | A |    | -- | - | - | 16.59± 0.05 | A |   | 16.26± 0.07 | - |  |
| 60342.09 | 16.91± 0.04 | A |    | 17.31± 0.03 | - |  | 16.58± 0.05 | - |  | 16.27± 0.07 | - |  |
| 60504.38 | 16.90± 0.04 | - |  | 17.22± 0.04 | - |  | 16.57± 0.05 | - |  | -- | - | - |
| 60506.37 | 16.91± 0.03 | A |   | 17.27± 0.03 | - |  | 16.56± 0.04 | - |  | 16.32± 0.07 | - |  |
| 60529.37 | 16.87± 0.04 | A |  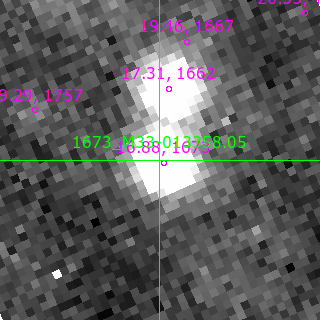 | 17.21± 0.06 | - | 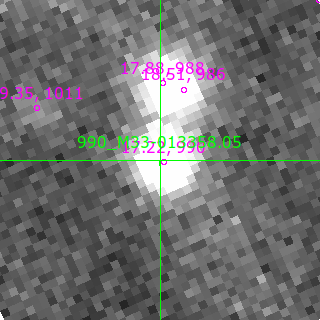 | -- | - | - | 16.28± 0.06 | - | 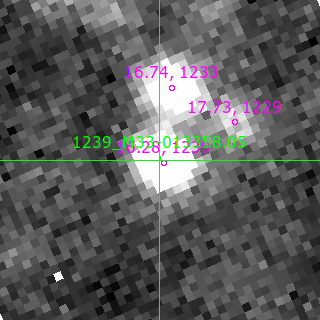 |
| 60533.38 | 16.90± 0.03 | - | 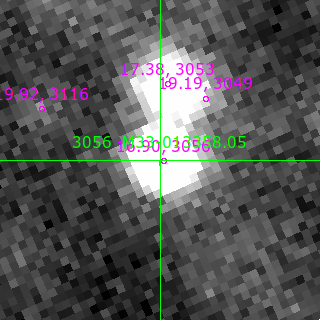 | -- | - | - | 16.57± 0.05 | - |  | 16.30± 0.08 | - |  |
| 60556.27 | 16.94± 0.04 | A |    | 17.29± 0.04 | A |   | 16.61± 0.04 | - |  | 16.27± 0.07 | - |  |
| 60564.22 | 16.98± 0.04 | - |  | 17.28± 0.07 | - |  | 16.62± 0.05 | - |  | -- | - | - |
| 60594.11 | 16.93± 0.04 | A | -- | - | - | 16.58± 0.05 | - | 16.31± 0.07 | A | |||
| 60595.13 | 16.87± 0.04 | - |  | 17.28± 0.07 | - |  | 16.56± 0.05 | - |   | -- | - | - |
| 60612.15 | 16.93± 0.04 | A |   | 17.27± 0.02 | - |  | 16.59± 0.06 | - |  | -- | - | - |
| 60651.16 | 16.94± 0.04 | A |    | 17.25± 0.05 | - |  | 16.66± 0.05 | - |  | 16.35± 0.09 | - |  |
| 61025.19 | 16.91± 0.10 | - |  | 17.24± 0.12 | - |  | 16.65± 0.12 | - |  | 16.32± 0.10 | - |  |
| 61052.19 | 16.99± 0.08 | - |  | 17.34± 0.09 | - |  | 16.64± 0.06 | - | 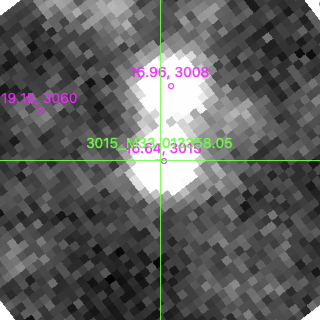 | -- | - | - |
| 61053.19 | 17.13± 0.05 | - | 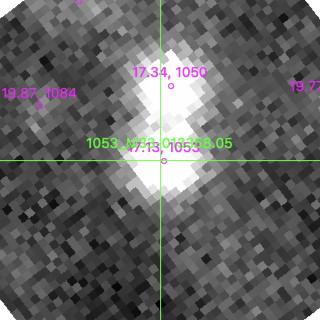 | 17.46± 0.06 | - | 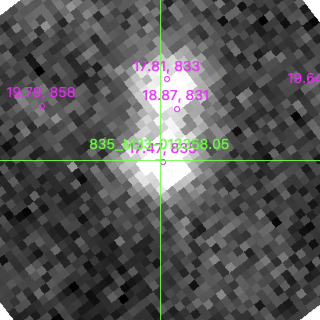 | -- | - | - | -- | - | - |
| 61055.17 | 16.97± 0.08 | - |  | -- | - | - | -- | - | - | 16.34± 0.07 | - |  |
| 61080.07 | 17.06± 0.09 | A |    | 17.38± 0.11 | A |   | 16.57± 0.05 | - |  | 16.61± 0.09 | - |  |
| 61083.04 | 17.05± 0.11 | - |  | -- | - | - | 16.73± 0.10 | - |  | -- | - | - |