Correlation factors between bands
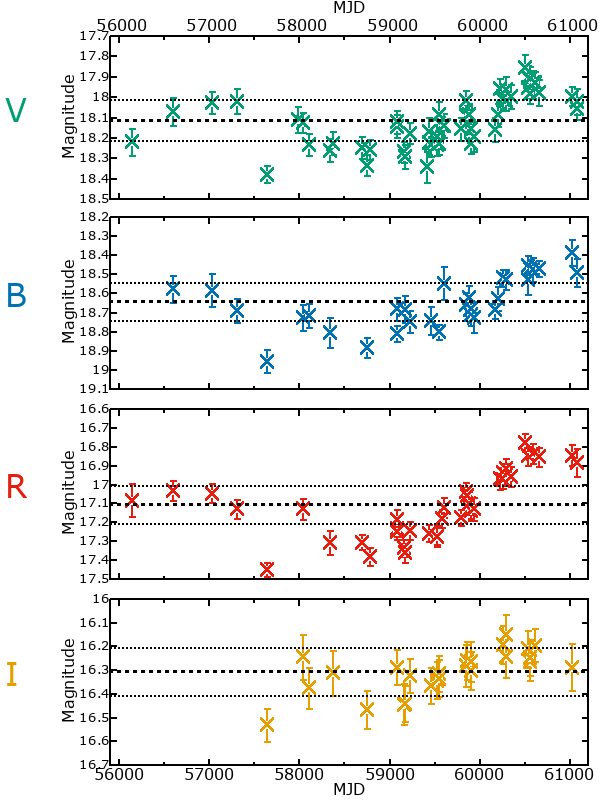
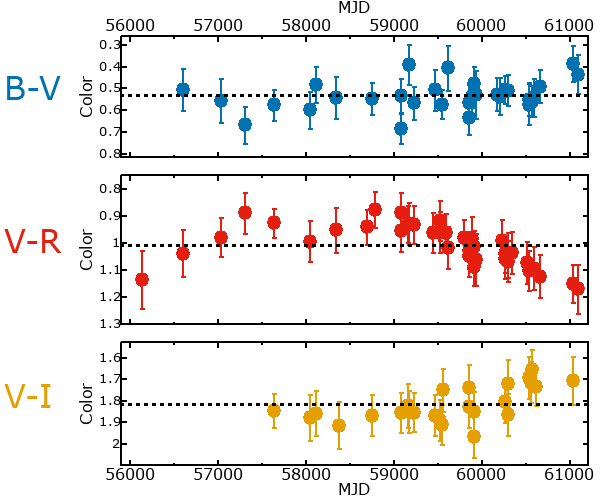
If the brightness variation is true variability then there should be a correlation between brightness changes recorded in different filter bands. The following table are the R-squared linear correlation factors calculated for the pairs of bands. The number in parentheses next to the R-squared value is the number of elements used to calculate the correlation factor. The number in square brackets next to the band is the range of magnitudes measured.
| V [0.52 mag] | B [0.57 mag] | R [0.67 mag] |
|---|
| B [0.57 mag] | 0.75 (32) | | |
|---|
| R [0.67 mag] | 0.86 (38) | 0.83 (23) | |
|---|
| I [0.38 mag] | 0.70 (25) | 0.53 (16) | 0.72 (14) |
|---|
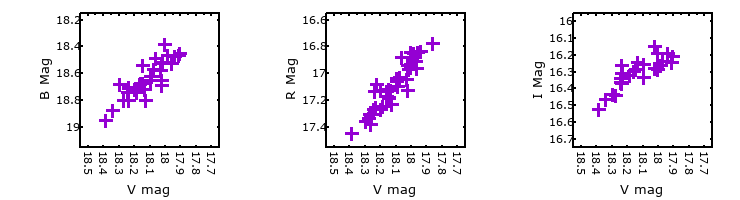
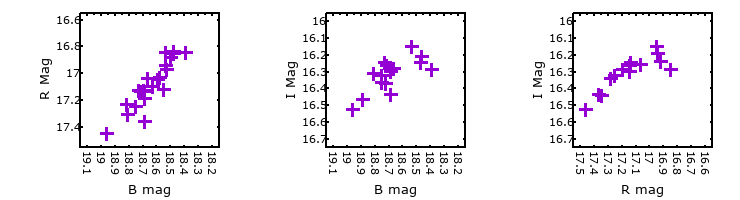
Magnitude-Magnitude Plots
The plots below are provided to check the values in the table above and also to show any non-linear correlations
I & R Statistics
Welch & Stetson (1993, AJ, 105, 1813) present a method for varible star detection in CCD images from automated surveys. Data from two bands are compared and two statistics are calculated: R and I.
The I-statistic has an expectation value of zero for stars that are NOT variable. A larger non-zero I-value indicates a higher likelihood that the star is variable. The R statistic indicates how the color of the star changes as the variable grows brighter with R = 1.0 being no change in color.
R and I values have only been calculated if there are more than four (4) matched measurements of brightness in each band.
| V
(I|R) | B
(I|R) | R
(I|R) |
|---|
B
(I|R) | 4.93 | 1.02 | | |
|---|
R
(I|R) | 7.64 | 0.64 | 2.01 | 0.06 | |
|---|
I
(I|R) | 2.68 | 2.53 | 2.54 | 2.12 | 4.45 | 3.07 |
|---|
By John C. Martin, University of Illinois Springfield Henry R. Barber Research Observatory
Generated on 2026-05-30 14:50:34 UT-5


