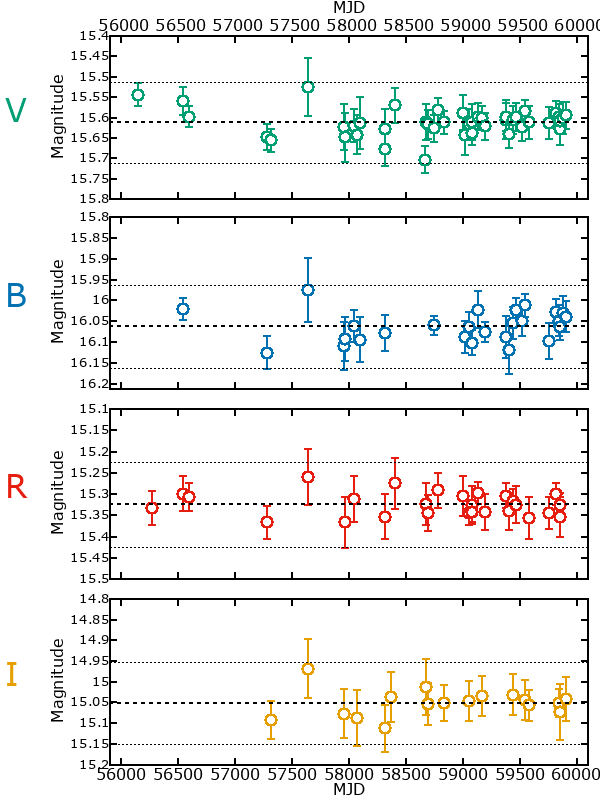
Photometry Table
| MJD | V | * | Image | B | * | Image | R | * | Images | I | * | Images |
|---|---|---|---|---|---|---|---|---|---|---|---|---|
| 56142.35 | 15.54± 0.03 | Tb |  | -- | - | - | -- | - | - | -- | - | - |
| 56267.17 | -- | - | - | -- | - | - | 15.33± 0.04 | Tb |  | -- | - | - |
| 56537.22 | 15.56± 0.03 | b |  | 16.02± 0.03 | b |  | 15.30± 0.04 | b |  | -- | - | - |
| 56593.08 | 15.60± 0.03 | b |  | -- | - | - | 15.31± 0.03 | b |  | -- | - | - |
| 57282.18 | 15.65± 0.03 | b |  | 16.12± 0.04 | b |  | 15.37± 0.04 | b |  | -- | - | - |
| 57314.14 | 15.66± 0.03 | b |  | -- | - | - | -- | - | - | 15.09± 0.05 | b |  |
| 57635.41 | 15.53± 0.07 | b |  | 15.98± 0.08 | b |  | 15.26± 0.07 | b |  | 14.97± 0.07 | b |  |
| 57958.32 | 15.62± 0.06 | b |  | 16.11± 0.06 | b |  | -- | - | - | 15.08± 0.06 | b |  |
| 57963.28 | 15.65± 0.06 | b |  | 16.09± 0.05 | b |  | 15.37± 0.06 | b |  | -- | - | - |
| 58045.07 | 15.62± 0.04 | b |  | 16.06± 0.04 | b |  | 15.31± 0.05 | b |  | -- | - | - |
| 58067.12 | 15.64± 0.05 | b |  | -- | - | - | -- | - | - | 15.09± 0.07 | b |  |
| 58098.12 | 15.61± 0.06 | b |  | 16.09± 0.05 | b |  | -- | - | - | -- | - | - |
| 58312.32 | 15.63± 0.05 | b |  | 16.08± 0.04 | b |  | 15.35± 0.05 | b |  | -- | - | - |
| 58316.28 | 15.68± 0.04 | b |  | -- | - | - | -- | - | - | 15.11± 0.06 | b |  |
| 58372.12 | -- | - | - | -- | - | - | -- | - | - | 15.04± 0.06 | Tb |  |
| 58403.12 | 15.57± 0.04 | b |  | -- | - | - | 15.28± 0.06 | b |  | -- | - | - |
| 58671.30 | 15.70± 0.03 | Tb |  | -- | - | - | -- | - | - | -- | - | - |
| 58672.32 | 15.61± 0.04 | b |  | -- | - | - | 15.32± 0.05 | b |  | 15.01± 0.07 | b |  |
| 58695.31 | 15.62± 0.04 | b |  | -- | - | - | 15.34± 0.04 | b |  | 15.05± 0.05 | b |  |
| 58750.10 | 15.63± 0.03 | b |  | 16.06± 0.02 | b |  | -- | - | - | -- | - | - |
| 58779.07 | 15.58± 0.03 | b |  | -- | - | - | 15.29± 0.04 | b |  | -- | - | - |
| 58836.18 | 15.61± 0.03 | b |  | -- | - | - | -- | - | - | 15.05± 0.04 | b |  |
| 59001.37 | 15.59± 0.04 | b |  | -- | - | - | 15.30± 0.05 | b |  | -- | - | - |
| 59019.33 | 15.64± 0.05 | b |  | 16.09± 0.04 | b |  | -- | - | - | -- | - | - |
| 59055.32 | 15.62± 0.04 | Ab |   | 16.06± 0.04 | b |  | 15.34± 0.03 | b |  | 15.05± 0.05 | Ab |   |
| 59077.22 | 15.61± 0.04 | b |  | -- | - | - | 15.33± 0.04 | b |  | -- | - | - |
| 59082.20 | 15.64± 0.03 | b |  | 16.10± 0.03 | b |  | 15.34± 0.02 | b |  | -- | - | - |
| 59131.06 | 15.60± 0.03 | Ab |   | 16.02± 0.04 | b |  | 15.30± 0.03 | b |  | -- | - | - |
| 59166.08 | 15.60± 0.03 | Ab |   | -- | - | - | -- | - | - | 15.03± 0.05 | Ab |   |
| 59194.08 | 15.62± 0.03 | Ab |   | 16.07± 0.02 | b |  | 15.34± 0.04 | b |  | -- | - | - |
| 59376.36 | 15.61± 0.05 | b |  | 16.09± 0.05 | b |  | -- | - | - | -- | - | - |
| 59379.35 | 15.60± 0.04 | b |  | -- | - | - | 15.30± 0.03 | b |  | -- | - | - |
| 59409.39 | 15.64± 0.03 | Ab |   | 16.12± 0.06 | b |  | 15.34± 0.04 | b |  | -- | - | - |
| 59442.28 | 15.61± 0.03 | Ab |   | 16.05± 0.04 | b |  | 15.32± 0.03 | b |  | 15.03± 0.05 | Ab |   |
| 59467.15 | 15.60± 0.03 | Ab |   | 16.02± 0.03 | b |  | 15.32± 0.04 | b |  | -- | - | - |
| 59522.07 | 15.62± 0.03 | b |  | 16.05± 0.04 | b |  | -- | - | - | -- | - | - |
| 59546.08 | 15.58± 0.03 | Ab |   | 16.01± 0.03 | b |  | -- | - | - | 15.04± 0.05 | b |  |
| 59583.08 | 15.61± 0.04 | Ab |   | -- | - | - | 15.36± 0.05 | b |  | 15.06± 0.04 | b |  |
| 59753.33 | 15.61± 0.04 | Ab |   | 16.10± 0.04 | b |  | 15.35± 0.04 | b |  | -- | - | - |
| 59816.18 | 15.59± 0.03 | Ab |   | 16.03± 0.03 | b |  | 15.30± 0.03 | b |  | -- | - | - |
| 59848.07 | 15.60± 0.03 | Ab |   | 16.05± 0.04 | b |  | -- | - | - | 15.05± 0.03 | b |  |
| 59851.07 | 15.63± 0.04 | b |  | -- | - | - | 15.35± 0.05 | b |  | 15.07± 0.07 | b |  |
| 59854.14 | 15.61± 0.03 | b |  | 16.07± 0.03 | b |  | 15.33± 0.03 | b |  | -- | - | - |
| 59879.07 | 15.60± 0.04 | b |  | 16.03± 0.04 | b |  | -- | - | - | -- | - | - |
| 59905.22 | 15.60± 0.03 | b |  | 16.04± 0.04 | b |  | -- | - | - | 15.04± 0.05 | b |  |
| 60147.30 | 15.59± 0.04 | Ab |   | 16.02± 0.03 | b |  | 15.28± 0.04 | b |  | -- | - | - |
| 60152.39 | 15.57± 0.04 | b |  | 16.03± 0.04 | b |  | -- | - | - | -- | - | - |
| 60172.29 | 15.59± 0.04 | Ab |   | -- | - | - | 15.30± 0.06 | Ab |   | 15.03± 0.06 | Ab |   |
| 60202.14 | 15.63± 0.04 | Ab |   | 16.08± 0.04 | Ab |   | 15.38± 0.06 | Ab |   | -- | - | - |
| 60251.05 | 15.56± 0.04 | Ab |   | 16.02± 0.03 | b |  | -- | - | - | 15.00± 0.05 | b |  |
| 60290.08 | 15.56± 0.04 | b |  | -- | - | - | -- | - | - | 15.03± 0.06 | b |  |
| 60292.09 | 15.54± 0.05 | b |  | -- | - | - | -- | - | - | 14.99± 0.08 | b |  |
| 60533.24 | 15.57± 0.04 | b |  | -- | - | - | -- | - | - | 14.99± 0.06 | b |  |
| 60555.18 | 15.57± 0.04 | b |  | 16.02± 0.03 | b |  | 15.29± 0.04 | b |  | -- | - | - |
| 60556.13 | 15.56± 0.04 | b |  | 15.98± 0.04 | b |  | 15.27± 0.04 | b |  | -- | - | - |
| 60594.03 | 15.59± 0.05 | b |  | -- | - | - | -- | - | - | 15.03± 0.07 | b |  |
| 60595.05 | 15.66± 0.06 | b |  | 16.11± 0.05 | b |  | 15.39± 0.05 | b |  | -- | - | - |
| 60651.06 | 15.61± 0.04 | b |  | 16.07± 0.04 | b |  | 15.31± 0.05 | b |  | -- | - | - |
| 60880.28 | 15.57± 0.06 | Ab |   | 16.05± 0.05 | b |  | 15.25± 0.08 | b |  | -- | - | - |
| 61025.11 | 15.52± 0.08 | Ab |   | 15.91± 0.07 | b |  | 15.26± 0.09 | b |  | -- | - | - |